


Functions of Information Palette
Allows you to display information such as the utilization rate of the system memory and coordinate.
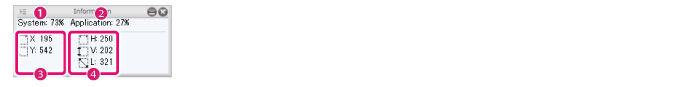
(1) System
Displays the memory load factor for the whole system.
Indicates the "amount of memory used by all applications" over the "amount of memory installed in your computer".

|
|
When [System] is close to 100%, the performance decreases. Quitting other running applications may lower the memory load factor for the system. |
(2) Application
Displays the memory load factor for the application.
Indicates the amount of memory currently used by Clip Studio Paint as a percentage of the available memory. The amount of memory available to Clip Studio Paint is configured in [Memory size to use] in [Preferences] > [Performance].

|
|
When [Application] is close to 100%, the performance decreases. Performing any of the operations below may lower the memory load factor for the application. ·Increase [Allocate to application] in the [Preferences] dialog box > [Performance]. ·Close unnecessary canvases. ·Perform [Edit] menu > [Clear Memory]. [PRO/EX] |
(3) Coordinate information
Displays the position of the mouse cursor on the canvas as the coordinate (X/Y).
(4) Length information
Displays the width (H), height (V), and diagonal line length (L) of the diagram when drawing a diagram such as a rectangle and circle, or creating a selection.