


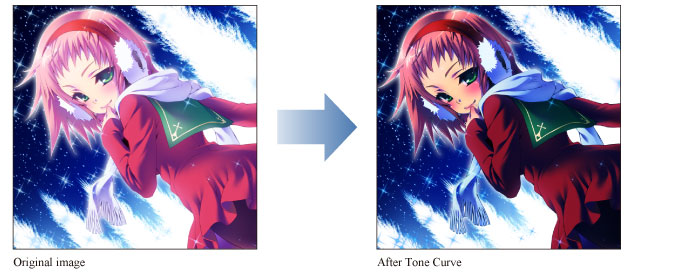
Tone curve [PRO/EX]
Select the [Edit] menu > [Tonal Correction] > [Tone Curve] to open the [Tone Curve] dialog box. You can adjust the brightness of the selected layer using the graph.
|
Applicable layers |
Raster layer (gray) Raster layer (color) |
|
|
·To learn how to apply a Tonal Correction effect to a layer, see "Applying a Tonal Correction". ·For information on the settings in the [Tone Curve] dialog box, please see the following section. |
[Tone Curve] Dialog Box
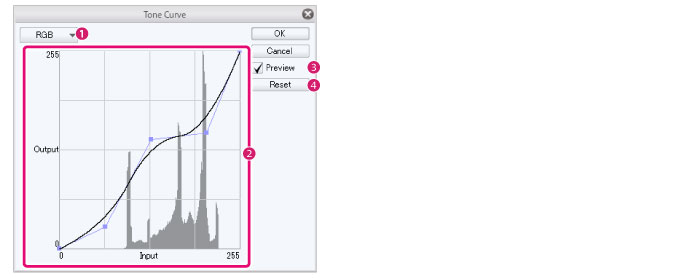
(1) Channel
Select a channel to adjust the brightness. You can choose from [RGB], [Red], [Green] and [Blue].
(2) Tone curve
A graph to adjust the contrast of the image. Drag the control points to adjust the contrast.
The horizontal axis of the graph is the "Input" value (original brightness) and the vertical axis is the "Output" value (brightness after adjustment).
|
|
·This graph displays the volume of the dark areas (left side) and bright areas (right side) as mountain-like peaks. Adjust the tone curve while checking the balance of the original image in the histogram. ·Click on the graph to create a new control point. ·To delete a control point, drag it outside of the graph. |
(3) Preview
Turn this on to preview the results on the canvas.
(4) Reset
Reset the image to the original state.