


Graph Editor
This is the edit screen of the Graph Editor on the Timeline palette.
You can use the Graph Editor to edit clips for the current frame on the selected track.
|
|
If [Enable keyframes on this layer] is turned off, you cannot switch to the Graph Editor. |
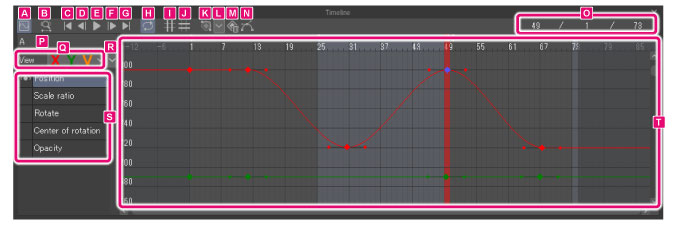
A.Graph Editor
Click this to switch the Timeline palette between the standard view and Graph Editor view.
B.Drag to zoom
Turn this option on to zoom in and out of the Timeline palette by dragging.
Dragging to the left will zoom in. Dragging to the right will zoom out.
|
|
When [Drag to zoom] is turned on, you can zoom in and out of the Timeline palette by right-clicking and dragging left or right. You can also zoom in and out of the Timeline palette using the mouse wheel. |
C.Go to start
Go to start selects the first frame of the clip.
D.Go to previous frame
This button selects the previous frame of the current frame in the Timeline palette.
E.Play/Stop
This button plays or stops animation on the canvas.
|
|
·Animation playback can also be stopped by pressing Esc or clicking a palette other than the Timeline palette during playback. ·When an animation is played, played frames will be cached. This allows the animation to buffer more quickly the next time it is played. However, the previous playback cache is discarded when the canvas or Timeline palette is edited. |
F.Go to next frame
This button selects the next frame of the current frame in the Timeline palette.
G.Go to end
Go to end selects the last frame of the clip.
H.Loop play
This button enables loop play. When playing animation, playback will return to the first frame after reaching the last frame.
I.Snap to X-axis
Snap to the X-axis when editing keyframes.
J.Snap to Y-axis
Snap to the Y-axis when editing keyframes.
K.Add keyframe
This button adds a keyframe to the frame selected in the Timeline palette.
|
|
·For details on adding keyframes, see "Add keyframe". ·For details on how to use keyframes, see "Using the Graph Editor". |
L.Keyframe interpolation
Click this to choose the interpolation method between frames when you add a new keyframe.
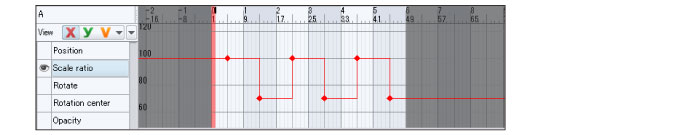
Create keyframe: Hold interpolation
The settings of the selected keyframe will be carried to the following keyframe at a fixed speed. The values are replaced when the next keyframe begins.
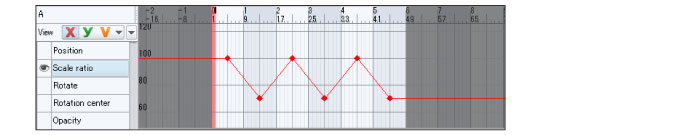
Create keyframe: Linear interpolation
The settings of the selected keyframe will be carried to the following keyframe at a fixed speed.
Create keyframe: Smooth interpolation
The speed will gradually increase after the selected keyframe and then slow down just before the next keyframe.

|
|
To change the keyframe interpolation after adding a keyframe, see "Changing the keyframe interpolation". |
M.Delete keyframe
Deletes the selected keyframe from the Timeline palette.
|
|
·For details on deleting keyframes, see "Delete keyframe". ·For details on how to use keyframes, see "Using the Graph Editor". |
N.Unpair handles
When this is turned on, the handles of the keyframe will operate independently.
While adjusting the curve with the tangents, the left and right control points can be operated separately.
O.Current frame/Start frame/End frame
Display the positions of the currently selected frame, the start frame and the end frame.
|
|
·In PRO and EX, the frames are displayed differently depending on the frame display method selected in [Playback time] in the [New] dialog box or the [New timeline] dialog box. ·The frame display method can be changed in [How to show frames] in the [Canvas Properties] dialog box. For details, see “Menu” > “View Menu” > “Canvas Properties” (PRO/EX). |
P.Track name
Displays the track name.
Q. View
Displays the x or y–axis of the animation curve. Allows for viewing the Animation curve list and making a selection.
Click the [Switch to Graph Editor] icon to display the x and y axes. You can also specify the axis you wish to display by checking the checkbox.
|
X graph |
Displays the x–axis animation curve. |
|
Y graph |
Displays the y–axis animation curve. |
|
Other |
Displays any other animation curve information. Curves uninfluenced by the x and y-axis such as [Opacity] and [Volume (%)] will be displayed here. |
R.Switch to List Editor
Selects settings from the [List Editor]. Click the icon to show a list of settings. Turns on the displayed setting in the [List Editor].
S.List Editor
Displays settings at can be edited with the animation curve. Clicking the eye icon shows/hides the animation curve.
|
|
Clicking the eye icon shows/hides multiple settings. |
T.Animation curve
Displays the curve. The vertical axis is the transform and opacity settings of the layers and camera. The horizontal axis is the timeline. Transformation timing and camera movement recorded in the Timeline palette such as move and rotate can be adjusted using the animation curve.
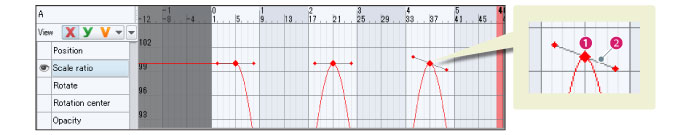
(1) Keyframe
A frame where layer opacity and transformations are recorded.
Transformation timing, camera position and angles can be edited by moving keyframes.
(2) Tangent
A tangent adjusts the curve of the line between keyframes. Moving the control points at the end of either side of the tangent adjusts the line curve.